(2023)
Close3:34 tile installation
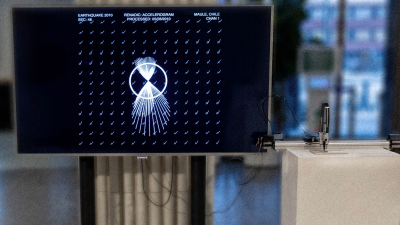
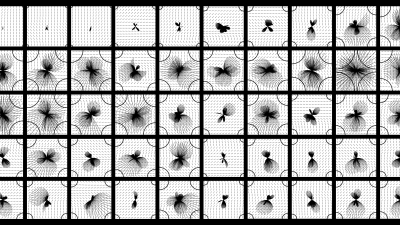
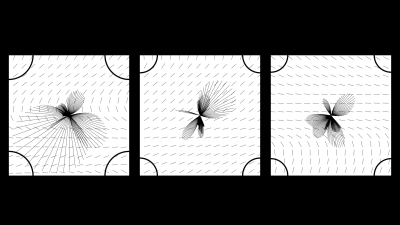
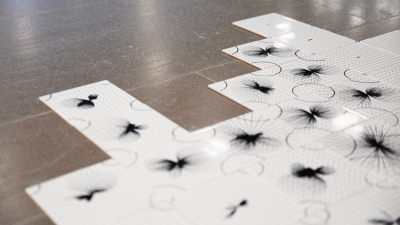
Data visualisation tiles for Chilean Earthquake (2010)
In parallel, a screen is displaying the full progression of the earthquake’s data, showing one slide per second for the 146 seconds of the duration of the natural phenomena.
The data source was taken from RENADIC Universidad de Chile and it’s open to the public in the following link: http://terremotos.ing.uchile.cl/registros/164. I selected the processed data from Constitución, as this location was the closest one to the epicenter. The data was then transformed to JSON format to be used in the code.
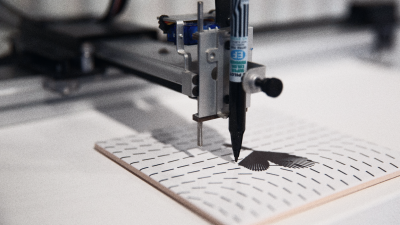
Printed with AxiDraw Plotter
Art [Personal]
New Media & Interactive

Mute/Unmute


Mute/Unmute
